KPI tile
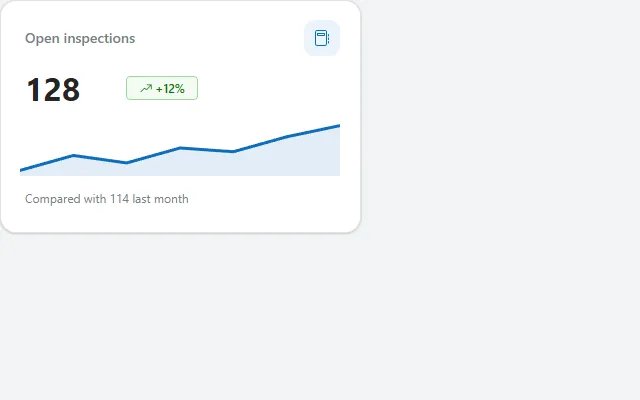
A stat card with label, icon, one big number, a trend badge and an SVG sparkline in the theme colour, drawn with Power Fx.
- Version
- 2.0.0
- Updated
- Verified in Studio
- Not yet
- Author
- Ynias Bensch
- Tags
Overview
One number with the context to read it: what it measures, how it moved, and a sparkline of the last seven periods. The tile is at most 360 pixels wide, so three or four fit side by side in a horizontal container.
The sparkline is an SVG built in Power Fx and shown in an Image control. It takes its colour from App.Theme.Colors.Primary through JSON(), so it follows the theme, and coordinates are rounded to whole numbers so the SVG works in every locale.
When to use
- The top row of a dashboard, three or four tiles wide.
- Numbers where the direction matters as much as the value.
When not to use
- Comparisons between categories: a bar chart or the progress ring explains those better.
- Values that are expensive to calculate on every visit; compute them once and store them in a variable.
Controls used
| Control | Version |
|---|---|
| GroupContainer | 1.5.0 |
| ModernText | 1.0.0 |
| ModernIcon | 1.1.1 |
| ModernBadge | 1.0.0 |
| Image | 2.2.3 |
YAML
Works as is, with example data inline. Paste it into a screen or container; the steps are underHow to paste.
Not yet verified in Power Apps Studio. The control versions are drafted from documentation. If Studio flags one, see How to paste for the fix.
- KpiTileRoot:
    Control: GroupContainer@1.5.0
    Variant: AutoLayout
    Properties:
      BorderColor: =ColorFade(App.Theme.Colors.Darker70, 88%)
      BorderThickness: =1
      DropShadow: =DropShadow.Light
      Fill: =Color.White
      Height: =KpiTileTop.Height + KpiTileValueRow.Height + KpiTileChart.Height + KpiTileFooter.Height + 3 * 8 + 40
      LayoutDirection: =LayoutDirection.Vertical
      LayoutGap: =8
      PaddingBottom: =20
      PaddingLeft: =20
      PaddingRight: =20
      PaddingTop: =20
      RadiusBottomLeft: =16
      RadiusBottomRight: =16
      RadiusTopLeft: =16
      RadiusTopRight: =16
      Width: =Min(360, Parent.Width)
    Children:
      - KpiTileTop:
          Control: GroupContainer@1.5.0
          Variant: AutoLayout
          Properties:
            AlignInContainer: =AlignInContainer.Stretch
            DropShadow: =DropShadow.None
            FillPortions: =0
            Height: =36
            LayoutAlignItems: =LayoutAlignItems.Center
            LayoutDirection: =LayoutDirection.Horizontal
            LayoutGap: =8
            LayoutMinHeight: =36
            LayoutMinWidth: =120
          Children:
            - KpiTileLabel:
                Control: ModernText@1.0.0
                Properties:
                  AccessibleLabel: =Self.Text
                  Color: =ColorFade(App.Theme.Colors.Darker70, 45%)
                  FillPortions: =1
                  FontWeight: =FontWeight.Semibold
                  Height: =30
                  LayoutMinHeight: =0
                  LayoutMinWidth: =80
                  Size: =14
                  Text: ="Open inspections"
                  Wrap: =false
            - KpiTileIcon:
                Control: ModernIcon@1.1.1
                Properties:
                  AccessibleLabel: ="Inspections"
                  Fill: =App.Theme.Colors.Lighter80
                  Height: =36
                  Icon: ="Notebook"
                  IconColor: =App.Theme.Colors.Primary
                  LayoutMinHeight: =36
                  LayoutMinWidth: =36
                  PaddingBottom: =8
                  PaddingLeft: =8
                  PaddingRight: =8
                  PaddingTop: =8
                  RadiusBottomLeft: =10
                  RadiusBottomRight: =10
                  RadiusTopLeft: =10
                  RadiusTopRight: =10
                  Width: =36
      - KpiTileValueRow:
          Control: GroupContainer@1.5.0
          Variant: AutoLayout
          Properties:
            AlignInContainer: =AlignInContainer.Stretch
            DropShadow: =DropShadow.None
            FillPortions: =0
            Height: =48
            LayoutAlignItems: =LayoutAlignItems.Center
            LayoutDirection: =LayoutDirection.Horizontal
            LayoutGap: =10
            LayoutMinHeight: =48
            LayoutMinWidth: =120
          Children:
            - KpiTileValue:
                Control: ModernText@1.0.0
                Properties:
                  AccessibleLabel: =Self.Text
                  FontWeight: =FontWeight.Bold
                  Height: =48
                  LayoutMinHeight: =0
                  LayoutMinWidth: =60
                  PaddingBottom: =0
                  PaddingTop: =0
                  Size: =32
                  Text: =Text(128, "#,##0")
                  Width: =96
                  Wrap: =false
            - KpiTileDelta:
                Control: ModernBadge@1.0.0
                Properties:
                  AccessibleLabel: ="Up 12 percent compared with last month"
                  Appearance: =BadgeAppearance.Tint
                  Content: ="+12%"
                  Height: =24
                  Icon: ="ArrowTrending"
                  Intent: =BadgeIntent.Positive
                  LayoutMinHeight: =24
                  LayoutMinWidth: =64
                  Shape: =BadgeShape.Rounded
                  Size: =12
                  Width: =72
      - KpiTileChart:
          Control: Image@2.2.3
          Properties:
            AccessibleLabel: ="Trend over the last seven months"
            AlignInContainer: =AlignInContainer.Stretch
            Height: =56
            # Replace the values list with your own series; the line takes the theme colour.
            Image: |
              =With(
                  {
                      values: [92, 104, 98, 110, 107, 119, 128],
                      color: Mid(JSON(App.Theme.Colors.Primary), 2, 7)
                  },
                  With(
                      {
                          top: Max(values, Value),
                          bottom: Min(values, Value),
                          step: 600 / (CountRows(values) - 1)
                      },
                      With(
                          {
                              points: Concat(
                                  Sequence(CountRows(values)),
                                  Round((Value - 1) * step, 0) & "," & Round(108 - (Index(values, Value).Value - bottom) / Max(top - bottom, 1) * 96, 0),
                                  " "
                              )
                          },
                          "data:image/svg+xml;utf8," & EncodeUrl(
                              "<svg xmlns='http://www.w3.org/2000/svg' viewBox='0 0 600 120' preserveAspectRatio='none'>" &
                              "<polygon points='0,120 " & points & " 600,120' fill='" & color & "' fill-opacity='0.12'/>" &
                              "<polyline points='" & points & "' fill='none' stroke='" & color & "' stroke-width='3' stroke-linejoin='round' stroke-linecap='round' vector-effect='non-scaling-stroke'/>" &
                              "</svg>"
                          )
                      )
                  )
              )
            ImagePosition: =ImagePosition.Stretch
            LayoutMinHeight: =56
            LayoutMinWidth: =100
            TabIndex: =0
      - KpiTileFooter:
          Control: ModernText@1.0.0
          Properties:
            AccessibleLabel: =Self.Text
            AlignInContainer: =AlignInContainer.Stretch
            Color: =ColorFade(App.Theme.Colors.Darker70, 45%)
            Height: =28
            LayoutMinHeight: =0
            LayoutMinWidth: =80
            Size: =12
            Text: ="Compared with 114 last month"
            Wrap: =false
Make it yours
The example runs on sample data. Replace these properties to connect it to your app.
Text on KpiTileLabel
What the number measures.
In the YAML
Text: ="Open inspections"Your version
Text: ="Overdue requests"Text on KpiTileValue
The number, formatted with a thousands separator.
In the YAML
Text: =Text(128, "#,##0")Your version
Text: =Text(CountRows(Filter(Requests, Status = "Overdue")), "#,##0")Content on KpiTileDelta
The change against the previous period. Update Intent (green, red) and AccessibleLabel on the badge to match.
In the YAML
Content: ="+12%"Your version
Content: =If(varDelta >= 0, "+", "") & Text(varDelta, "0%")Image on KpiTileChart
The sparkline. Only the values list needs to change; the rest draws the line and the soft fill under it in the theme colour.
In the YAML
Image: |
  =With(
      {
          values: [92, 104, 98, 110, 107, 119, 128],
          color: Mid(JSON(App.Theme.Colors.Primary), 2, 7)
      },
      With(
          {
              top: Max(values, Value),
              bottom: Min(values, Value),
              step: 600 / (CountRows(values) - 1)
          },
          With(
              {
                  points: Concat(
                      Sequence(CountRows(values)),
                      Round((Value - 1) * step, 0) & "," & Round(108 - (Index(values, Value).Value - bottom) / Max(top - bottom, 1) * 96, 0),
                      " "
                  )
              },
              "data:image/svg+xml;utf8," & EncodeUrl(
                  "<svg xmlns='http://www.w3.org/2000/svg' viewBox='0 0 600 120' preserveAspectRatio='none'>" &
                  "<polygon points='0,120 " & points & " 600,120' fill='" & color & "' fill-opacity='0.12'/>" &
                  "<polyline points='" & points & "' fill='none' stroke='" & color & "' stroke-width='3' stroke-linejoin='round' stroke-linecap='round' vector-effect='non-scaling-stroke'/>" &
                  "</svg>"
              )
          )
      )
  )
Your version
Image: |
  =With(
      {
          values: ForAll(Sequence(7, 6, -1), CountRows(Filter(Requests, Month(Created) = Month(EDate(Today(), -Value))))),
          color: Mid(JSON(App.Theme.Colors.Primary), 2, 7)
      },
      With(
          {
              top: Max(values, Value),
              bottom: Min(values, Value),
              step: 600 / (CountRows(values) - 1)
          },
          With(
              {
                  points: Concat(
                      Sequence(CountRows(values)),
                      Round((Value - 1) * step, 0) & "," & Round(108 - (Index(values, Value).Value - bottom) / Max(top - bottom, 1) * 96, 0),
                      " "
                  )
              },
              "data:image/svg+xml;utf8," & EncodeUrl(
                  "<svg xmlns='http://www.w3.org/2000/svg' viewBox='0 0 600 120' preserveAspectRatio='none'>" &
                  "<polygon points='0,120 " & points & " 600,120' fill='" & color & "' fill-opacity='0.12'/>" &
                  "<polyline points='" & points & "' fill='none' stroke='" & color & "' stroke-width='3' stroke-linejoin='round' stroke-linecap='round' vector-effect='non-scaling-stroke'/>" &
                  "</svg>"
              )
          )
      )
  )
How to paste
- Open your app in Power Apps Studio.
- Check that modern controls are on: Settings → Updates → Modern controls and themes. In newer environments they are on by default.
- Copy the YAML with the Copy button above the code.
- In the Tree view, select the screen or container that should hold the component and press Ctrl+V. The whole component arrives as one container,
KpiTileRoot, with all its controls inside. - Work through Make it yours to swap the example data for your own.
Where your version of Studio has a code view for a control or screen, you can paste the same YAML there instead of into the tree view.
When Studio flags a control version
Each control in the YAML names its version, like Control: ModernButton@1.0.0. If that version is newer than what your environment knows, Studio falls back to the version it has or flags the control. All controls of one type in an app must also use the same version, so an app that already has an older ModernButton can reject the paste. To fix it, insert the same control from the Insert pane, copy it as code, note the version on its Control: line, update every matching line in the YAML and paste again.
Missing a component, or did this one not paste cleanly? Suggest a component or report an issue.